
Pest Control Route Optimization: How to Service More Customers with Less Drive Time
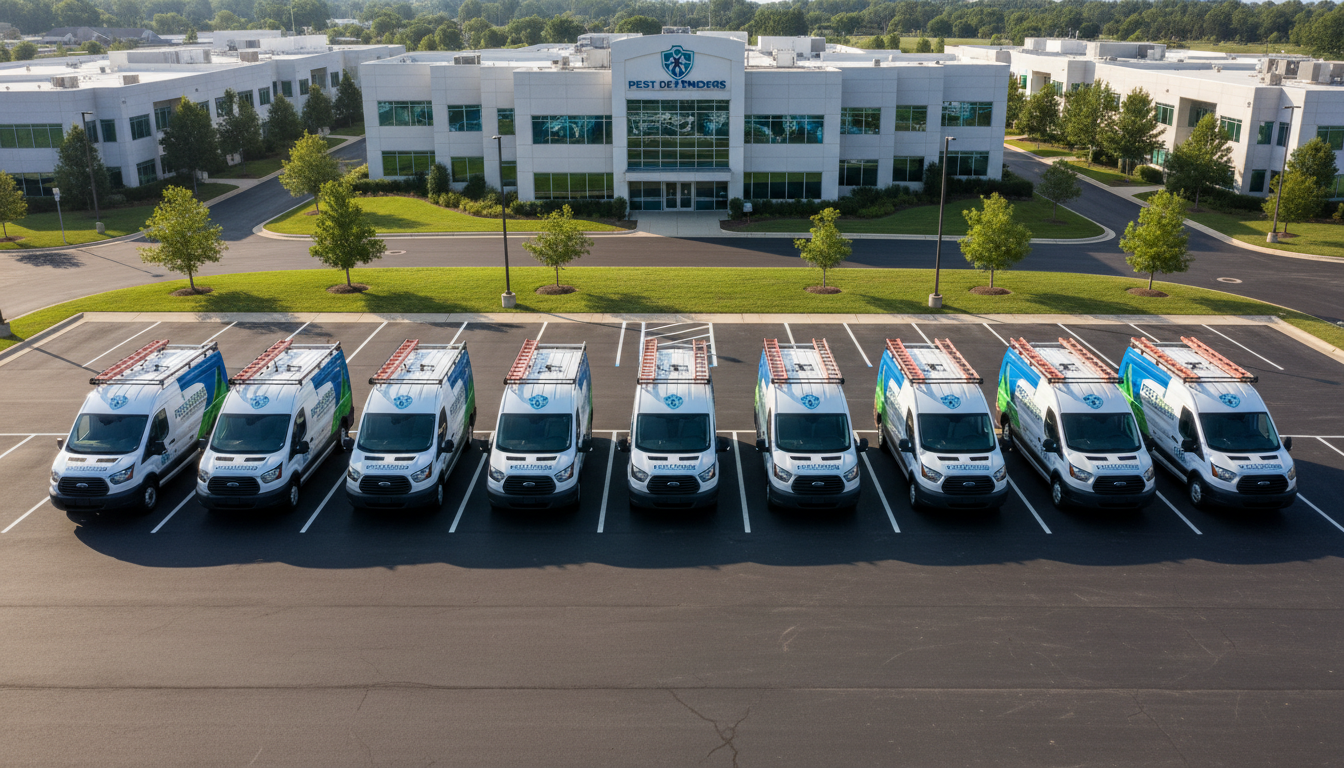
The average pest control technician spends 35-40% of their workday driving. Not treating. Not selling. Not generating revenue. Just sitting behind the wheel. If you run a 5-truck operation with technicians each earning $50,000 loaded, that means you are paying roughly $87,500 a year in wages just for windshield time. Add fuel, vehicle wear, and insurance, and inefficient routing can easily cost a small fleet $120,000+ annually in wasted capacity.
Route optimization is not a "nice to have" — it is the single highest-ROI operational improvement most pest control companies can make. The math is unforgiving: operators who optimize their routing complete 20-30% more stops per day, cut fuel costs by 20-40%, and generate $50,000-$100,000 more annual revenue per technician without hiring a single additional employee.
Here is how to do it, whether you are a solo operator with a map and a notebook or a multi-truck fleet ready for software-assisted scheduling.
20-40%
Fuel Savings with Optimized Routing
2-3 Extra
Daily Stops per Technician
25%
Reduction in Per-Job Labor Cost
The Route Density Math Every Operator Should Know
Route density is the foundation of pest control profitability. It measures how many service stops you have within a defined geographic area. Higher density means less driving between stops, more time treating, and dramatically better economics.
Here is a concrete example that illustrates the impact:
Technician A: Low Density Route
- Service area: 30-mile radius, mixed urban and suburban
- Average drive between stops: 18 minutes
- Stops per day: 6
- Daily drive time: 108 minutes (not counting commute)
- Daily revenue at $65 average ticket: $390
- Monthly revenue (22 working days): $8,580
Technician B: High Density Route
- Service area: 10-mile radius, concentrated suburban
- Average drive between stops: 7 minutes
- Stops per day: 10
- Daily drive time: 63 minutes (not counting commute)
- Daily revenue at $65 average ticket: $650
- Monthly revenue (22 working days): $14,300
$5,720/month
Revenue Difference Between Low and High Density Routes — Same Technician, Same Pricing
Same technician, same skill level, same pay rate, same vehicle. The only difference is route density. Technician B generates 67% more revenue by driving 42% fewer minutes. Over a full year, that density advantage is worth $68,640 per technician. If you have four technicians, we are talking about a $274,560 difference in annual revenue just from route design.
Geographic Clustering: The Core Strategy
Geographic clustering means deliberately concentrating your customer base into tight service zones. Every marketing dollar, every sales effort, and every scheduling decision should reinforce cluster density.
How to Build Clusters
- Map your existing customers. Export your customer addresses and plot them on a map. Most pest control software does this automatically. If you are not using software yet, Google My Maps is free and works fine as a starting point.
- Identify natural clusters. You will see groupings — neighborhoods, subdivisions, commercial districts. These are your core zones.
- Define service territories. Draw boundaries around each cluster. Each territory should be coverable by one technician in a single day with minimal driving.
- Fill the gaps. Focus your marketing efforts — door hangers, yard signs, local SEO, and direct mail — on neighborhoods adjacent to existing clusters. You want to grow your density outward from strength, not scatter customers across the map.
- Assign technicians to territories. Each technician owns their zone. They learn the neighborhoods, build relationships with customers, and develop route efficiency that a rotating assignment model can never match.
Pro Tip
After every new customer signs up, check how they fit into your existing route zones. If a new customer is isolated — 15+ minutes from your nearest cluster — charge a premium or offer them a specific service day when you have other nearby stops scheduled. Never let a single outlier customer destroy an entire day's route efficiency.
Software-Assisted Scheduling and Routing
Manual routing works for solo operators with 200-300 accounts. Once you pass that threshold, or add a second technician, software-assisted routing pays for itself almost immediately. According to PestPac, companies using their route optimization tool service 20% more customers per technician and spend 30% less on fuel.
What Route Optimization Software Actually Does
Modern route optimization platforms go far beyond MapQuest-style point-to-point directions. They:
- Simulate multi-day scheduling: The algorithm looks at all customers due for service in a given period and assigns them to specific days and technicians to maximize geographic clustering.
- Account for service time windows: Customers with morning-only or afternoon-only availability are automatically slotted into routes without creating backtracking.
- Factor in traffic patterns: Real-time and historical traffic data adjusts route sequences to avoid congestion during peak hours.
- Balance workloads: Routes are distributed evenly across technicians so nobody finishes at 1 PM while another works until 6 PM.
- Integrate pest-specific scheduling: Some platforms weight service urgency based on pest recurrence patterns, prioritizing sites with historical high infestation levels.
Leading Software Options
| Software | Best For | Route Optimization | Starting Price |
|---|---|---|---|
| PestPac (WorkWave) | Mid to large operations | Advanced (RouteOp module) | Custom pricing |
| FieldRoutes | Growth-stage companies | Built-in with AI | Custom pricing |
| Briostack | Small to mid operations | Integrated routing | ~$50/user/month |
| Pocomos | Budget-conscious operators | Built-in optimization | ~$65/month base |
| GorillaDesk | Solo to small teams | Basic routing | ~$49/month |
For a complete comparison, read our guide on the best pest control software platforms.
Key Takeaway
If you are running 500+ accounts or 2+ technicians without route optimization software, you are almost certainly leaving $30,000-$60,000 in annual revenue on the table. The subscription cost is typically recouped within the first month through fuel savings and additional stops alone.
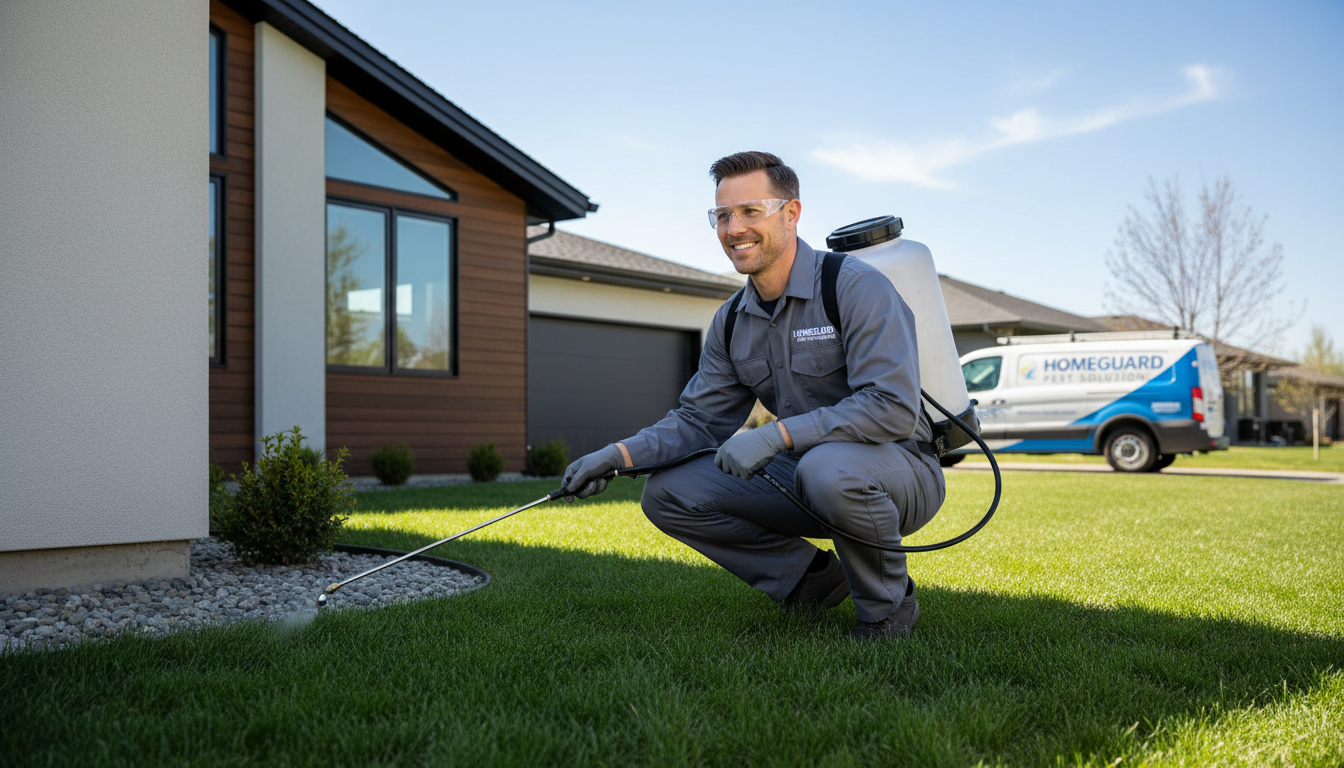
Balancing Emergency Calls with Recurring Routes
One of the biggest route killers in pest control is the unplanned emergency call. A customer finds a wasp nest, a restaurant has a rodent sighting, a real estate agent needs a termite inspection by tomorrow. How you handle these disruptions determines whether your routes stay efficient or collapse into chaos.
The Two-Tier System
Tier 1: True emergencies. Health and safety issues, regulatory compliance calls, and high-value commercial accounts that need same-day response. These justify pulling a technician off route. But the key is to pull the closest technician, not just the first one who answers the radio. GPS fleet tracking makes this possible — you dispatch the truck that is 5 minutes away, not the one that is 30 minutes away on the other side of town.
Tier 2: Urgent but not emergency. The customer has a problem that needs attention within 24-48 hours, but not today. These get slotted into the next available route window in the correct geographic zone. Train your CSRs to triage calls properly — most "emergencies" can actually wait a day if the customer is handled with empathy and given a specific appointment time.
Important
Build 15-20% buffer time into your daily routes. If your theoretical maximum is 10 stops, schedule 8-9 and leave room for one emergency or callback. A route with zero slack breaks the moment anything unexpected happens — and in pest control, unexpected is the norm.
Dedicated Emergency Capacity
Once you have 4+ technicians, consider designating one technician per day as the "flex" route. This technician handles callbacks, emergency calls, new customer initial services, and catch-up work. Their route is intentionally loose, geographically centered on your highest-density zone. This protects the other technicians' routes from disruption while maintaining your response time commitment to customers.
Fuel and Vehicle Cost Reduction
Fuel is typically the third-largest operating cost in pest control, behind labor and materials. Optimized routing attacks this cost directly:
- Fewer total miles driven. Eliminating backtracking and reducing inter-stop distances can cut daily mileage by 20-30%. On a truck averaging 15,000 miles per year, that is 3,000-4,500 fewer miles.
- Less idle time. Tight routes mean less time sitting in traffic. Idling a service truck burns 0.5-0.8 gallons per hour.
- Reduced vehicle wear. Fewer miles means longer intervals between oil changes, tire replacements, and brake services. A well-routed fleet spends 15-20% less on maintenance annually.
- Lower insurance costs. Some commercial auto insurance providers offer discounts for fleets that demonstrate lower annual mileage through GPS tracking and route optimization.
The Dollar Impact
| Cost Category | Per Truck/Year (Unoptimized) | Per Truck/Year (Optimized) | Annual Savings |
|---|---|---|---|
| Fuel (15K vs 11K miles) | $4,500 | $3,300 | $1,200 |
| Maintenance | $3,200 | $2,600 | $600 |
| Tire replacement | $800 | $600 | $200 |
| Insurance reduction | $2,400 | $2,200 | $200 |
| Total per truck | $10,900 | $8,700 | $2,200 |
For a 5-truck fleet, that is $11,000 per year in direct cost savings — before counting the revenue uplift from additional stops. Combined with the productivity gains, route optimization typically delivers $15,000-$25,000 per truck in total economic value annually.
Measuring Efficiency: The KPIs That Matter
You cannot improve what you do not measure. Here are the specific metrics every pest control operator should track for route efficiency:
Primary Metrics
- Stops per technician per day: Industry average is 6. Target is 8-10. If you are below 6, your routes need work. Track this weekly and discuss trends in team meetings.
- Drive time percentage: Total drive time divided by total work time. Target: below 30%. If you are above 40%, routing is your biggest bottleneck.
- Revenue per technician per day: Multiply average ticket by stops per day. This is the ultimate productivity metric. Track it per technician to identify who needs route adjustments or coaching.
- Revenue per mile driven: Total daily revenue divided by total daily miles. Higher is better. This metric captures both route density and pricing efficiency in a single number.
Secondary Metrics
- Completion rate: Percentage of scheduled stops actually completed. Target: 95%+. Low completion rates indicate scheduling problems, access issues, or no-shows that need process fixes.
- Callback rate: Percentage of customers requiring a return visit. High callback rates (above 5%) destroy route efficiency because every callback displaces a revenue-generating stop.
- Technician utilization: Billable hours divided by total hours. High-performing companies target 70-75%, with specialized operations pushing 85%. Below 60% indicates significant routing or scheduling inefficiency.
Pro Tip
Create a weekly route efficiency scorecard for each technician. Post it where the team can see it. Make it a friendly competition. Technicians who understand the metrics — and can see how they compare to their peers — naturally start making better route decisions throughout the day. Operators who track and share these numbers report 10-15% efficiency improvements within 90 days, without any software changes.
Optimization for Solo Operators (No Software Required)
If you are a one-truck operation and not ready for software, you can still dramatically improve routing with manual methods:
- Day-of-week zoning. Divide your service area into 5 zones, one per weekday. Monday is always the north zone, Tuesday is the east zone, and so on. Schedule recurring customers on the day that matches their zone, period.
- Time-window clustering. Group morning stops near each other and afternoon stops near each other. Start your day at the furthest point from home and work your way back.
- Batch scheduling. When customers call to schedule, offer them the day that matches their zone. "I service your area on Wednesdays — would morning or afternoon work better?" This simple script builds density automatically over time.
- Decline outlier jobs. If a potential customer is 25 minutes from your nearest other customer, refer them to someone else or charge a trip fee that compensates for the lost productivity. One outlier can cost you two stops.
Advanced Strategies for Multi-Truck Fleets
Seasonal Route Rebalancing
Pest control demand is seasonal. Summer brings mosquito, ant, and wasp calls. Fall shifts to rodent exclusion. Winter drops to maintenance mode. Your routes should adjust accordingly — rebalance territories quarterly to maintain density as the service mix and customer activity changes.
New Customer Onboarding Windows
Instead of scheduling new customer initial services whenever they sign up, batch them into designated time slots within existing route zones. "We have availability in your area on Thursday afternoon" converts nearly as well as "we can be there tomorrow" while protecting your route structure.
Predictive Scheduling
Use your historical data to predict which neighborhoods will need service in the upcoming month. If you know a subdivision has 40 quarterly customers due in March, pre-build those routes 2-3 weeks in advance. This lets you fill gaps with targeted marketing to non-customers in the same neighborhood.
Route optimization is not a one-time project — it is an ongoing discipline that compounds over time. Every small improvement in density, every eliminated backtrack, every emergency call handled without blowing up an entire day's schedule makes your operation more profitable. The operators who treat routing as a core competency — not an afterthought — are the ones who successfully scale from solo to fleet while maintaining healthy margins.
Want to see how improved routing impacts your bottom line? Try our ROI Estimator to model the financial impact, or browse our directory of 30,000+ pest control companies to see how top operators in your market are running their businesses.
Related Articles
Why Pest Control Companies Are Booming: Industry Trends for 2026
Key Takeaways The U.S. pest control industry generates over $24 billion in annual revenue and has ...

Pest Control for New Homeowners: Your First-Year Checklist
Key Takeaways Schedule a professional pest inspection within the first 30 days of homeownership — ...
How Much Does Pest Control Cost in 2026? A Complete Pricing Guide
Key Takeaways The average one-time pest control treatment costs $150–$350, while quarterly service...